This blog highlights findings from an exploratory study currently in preparation that seeks to characterize student clients who report paid employment compared to those who don’t.
O’Shea, A., Coduti, W., Pottschmidt, N., & Hayes, J. (2022). Student workers: Employment among help-seeking college students [Manuscript in preparation]. The Pennsylvania State University.
Background and Current Study
Demand for postsecondary education is growing, as earning a college degree is associated with improved lifetime earnings, job satisfaction, quality of life, health, and social mobility (Kiel et al., 2019). However, rising tuition costs and parallel policy changes place incredible financial burden on degree-seeking students, often disproportionately impacting those from underserved groups and backgrounds, including first-generation college students, students with disabilities, and racially/ethnically minoritized students. Experience with paid employment as a college student can play an important role in supporting individual and family financial needs and in allowing students to gain marketable skills before graduation. Research has shown that the relationship between work and student success is complicated, though, and whether work positively or negatively impacts a student can depend on why students choose to work and what their experiences at work are (Stern & Nakata, 1991). When paid employment during the academic year exceeds 20-hours-per-week, for example, students experience worsened physical and mental health and have higher rates of burnout and attrition (Benner & Curl, 2018). Despite this line of research findings, no known literature examines help-seeking in college students who work. College counseling services are often well-placed to serve not only students’ mental health needs, but career-related concerns as well. It is crucial to better understand the relationship between student employment and help-seeking so that counseling centers and universities can best support working students toward retention and ultimate career success.
The goal of this study is to better understand the prevalence and experience of students in college counseling who report paid employment in a nationally representative sample from CCMH centers. Specifically, we explored the following research questions:
- How much do treatment-seeking college students work?
- Are there differences in student demographics based on their reported number of hours worked?
- Are there differences in presenting concerns for students who work and those who do not work?
To address these questions, we obtained CCMH data from the 2019-2020 academic year. Clients were included if they had attended at least one counseling appointment, had at least one administration of the CCAPS-34, responded to an item on the SDS assessing paid employment, and were either an undergraduate or graduate student. Due to restrictions often placed on international students regarding paid employment, only domestic students were included. Furthermore, in order to mitigate confounding effects from widespread and varied responses of colleges and universities to the COVID-19 pandemic, clients whose first appointment was after March 6, 2020 were excluded.
After all inclusion and exclusion criteria were applied, the sample comprised 69,844 treatment-seeking undergraduate and graduate students. The mean age of clients was 21.6 years (sd = 3.9), a majority were women (65.4%), and a majority were White (69.4%), with representation from minoritized racial/ethnic groups including clients who identified as African American/Black (9.7%), Hispanic/Latinx (9.2%), and Asian American/Asian (4.8%).
Result Highlights
Employment Frequency
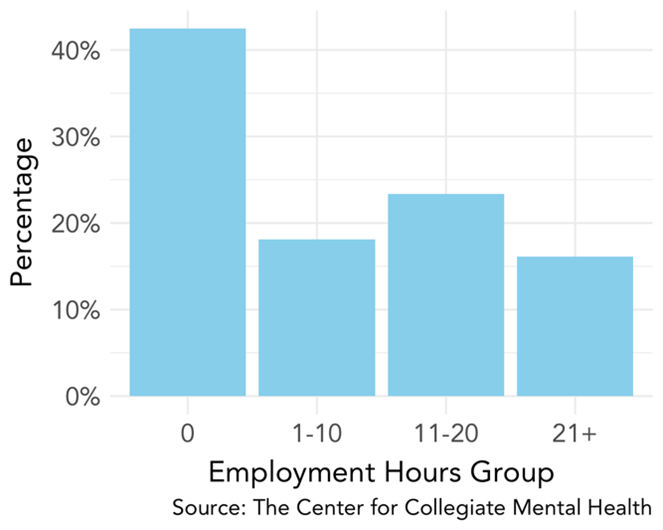
Out of our sample of 69,844 students, 42.5% reported no paid employment at the time they presented for counseling. Thus, the majority of students reported some level of paid employment:
Demographic Differences
We sought to understand whether there were any differences in client characteristics based on their weekly hours of paid employment (0, 1-10, 11-20, and 21+), and several notable trends emerged.
Age & Academic Status
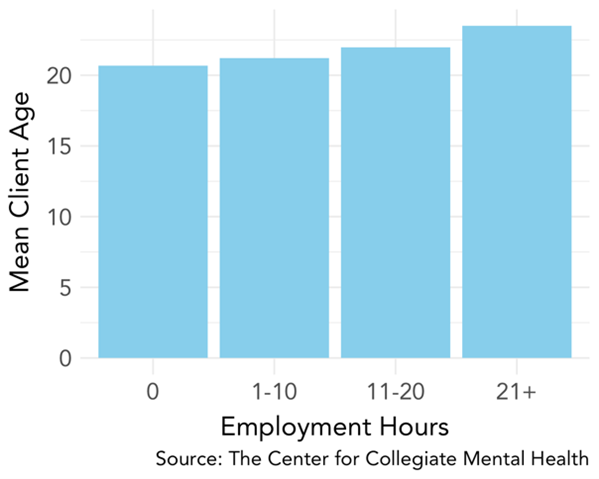
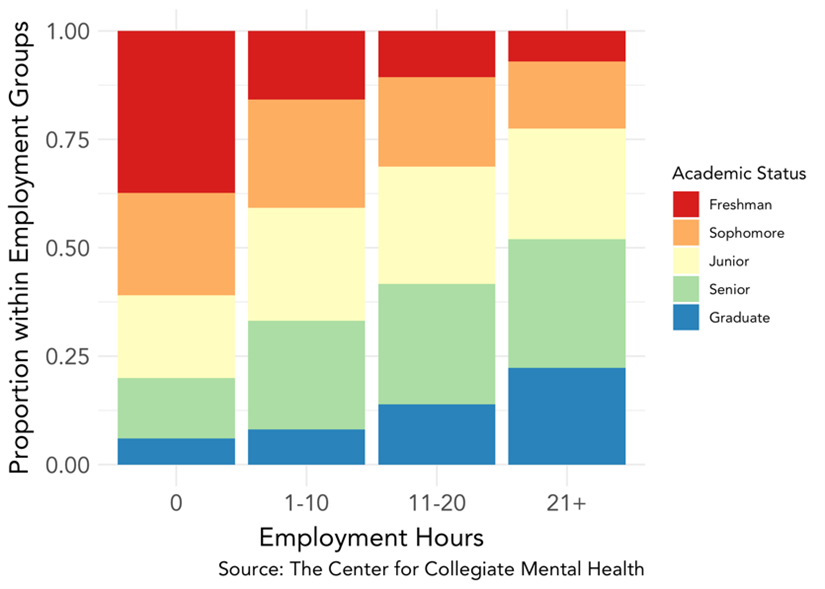
Students’ average age increases with each successive employment hours group, such that students who do not work are the youngest, on average, and those working more than 20 hours are the oldest. The trend for academic status closely parallels that for age, such that nonworking students are most likely to be first-year undergraduates while students reporting more than 20 paid hours per week are most likely to be fourth-year undergraduate or graduate students.
First-Generation Status
While first-generation students (FGS; defined as a student who does not have a parent with a four-year college degree) make up 22.9% of our sample overall, these students are disproportionately likely to work 11-20 hours per week (26.2% of this group) or 21+ hours (33.4%).
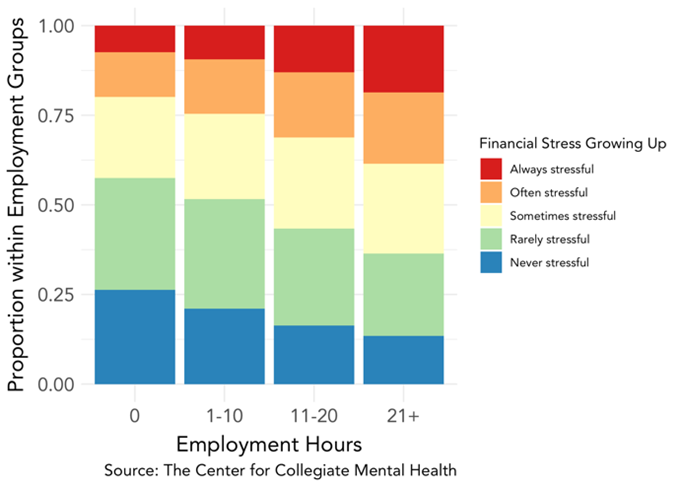
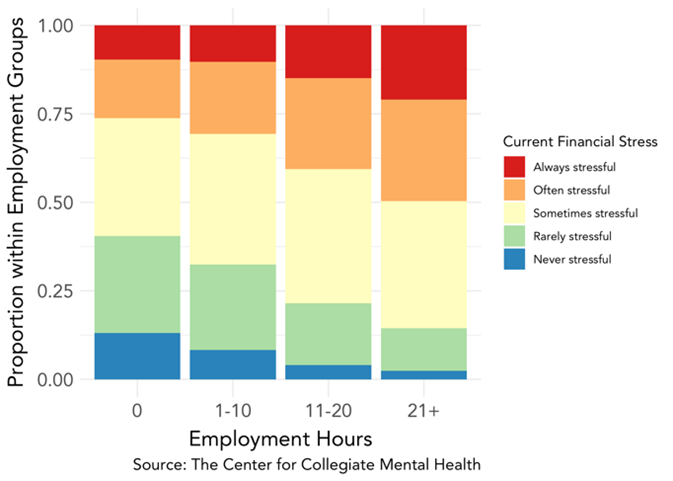
Financial Distress
The SDS contains two items asking about clients’ level of financial distress: one asking how often finances were stressful growing up, and one asking how often finances are currently stressful. We found that clients who work more hours per week are more likely to report more frequent financial distress both growing up and currently.
Race and Ethnicity
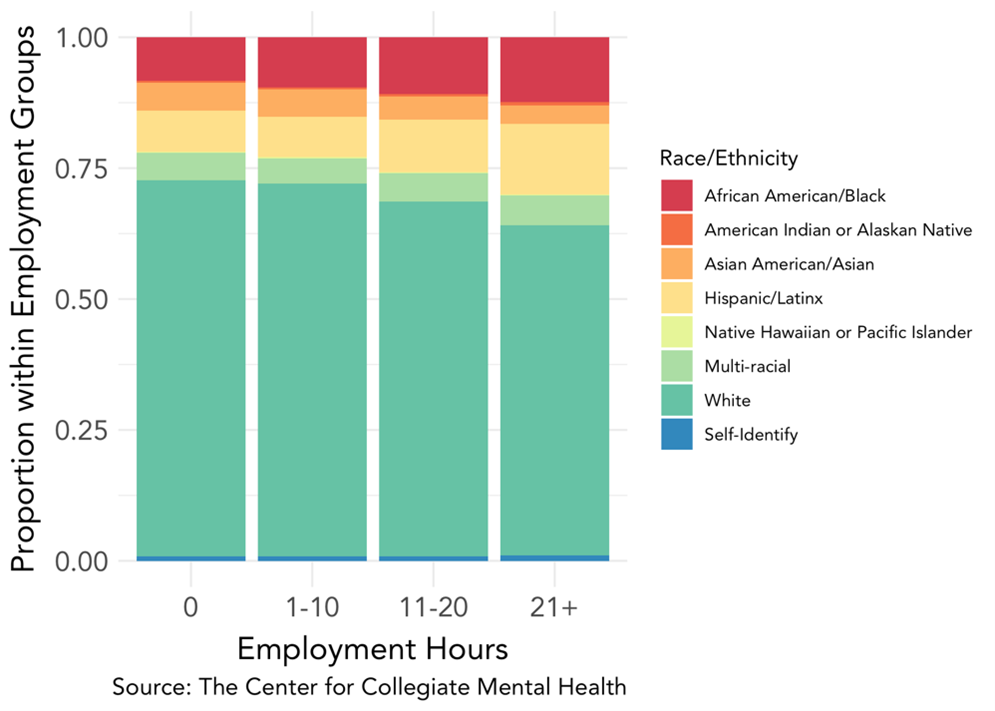
While the trends for racial and ethnic identities across employment hour groups are complex, there are some clear patterns. We found that students identifying as White or Asian American/Asian were more likely to work 10 hours or less. On the other hand, students identifying as African American/Black or Hispanic/Latinx were disproportionately represented in the group of students working 21+ hours.
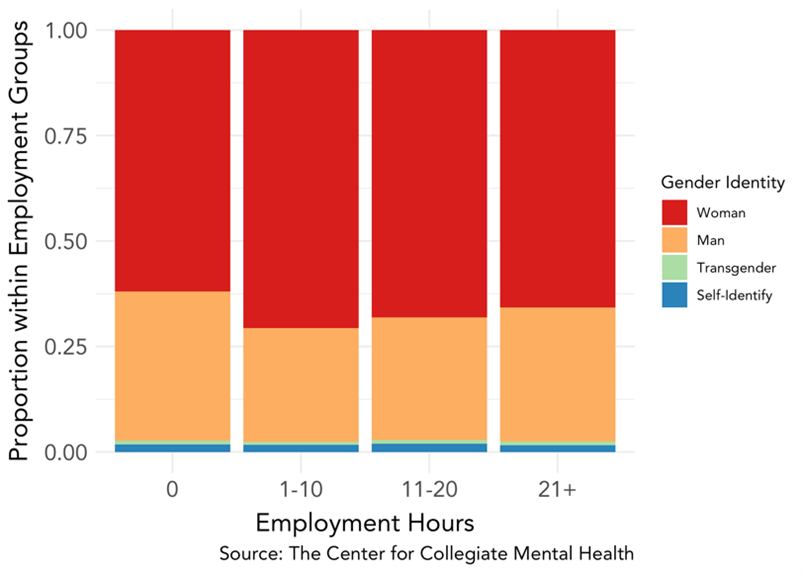
Gender Identity
We found that similar proportions of clients identifying as transgender (0.8-0.9%) or self-identifying their gender (1.6-1.9%) appear in all four employment hour groups. There were, however, differences across employment hours by the relative percentages of cisgender men and women. Compared to the overall gender breakdown of the sample, where women are the majority, we found that men are relatively over-represented in the nonworking group while women are relatively over-represented in the group working 1-10 hours per week.
Disability Status
While clients with a registered disability make up 10.1% of this sample, these clients are over-represented in the nonworking group (11.7%) and under-represented in groups working 11-20 (8.8%) or 21+ hours (7.0%).
Differences in Presenting Concerns
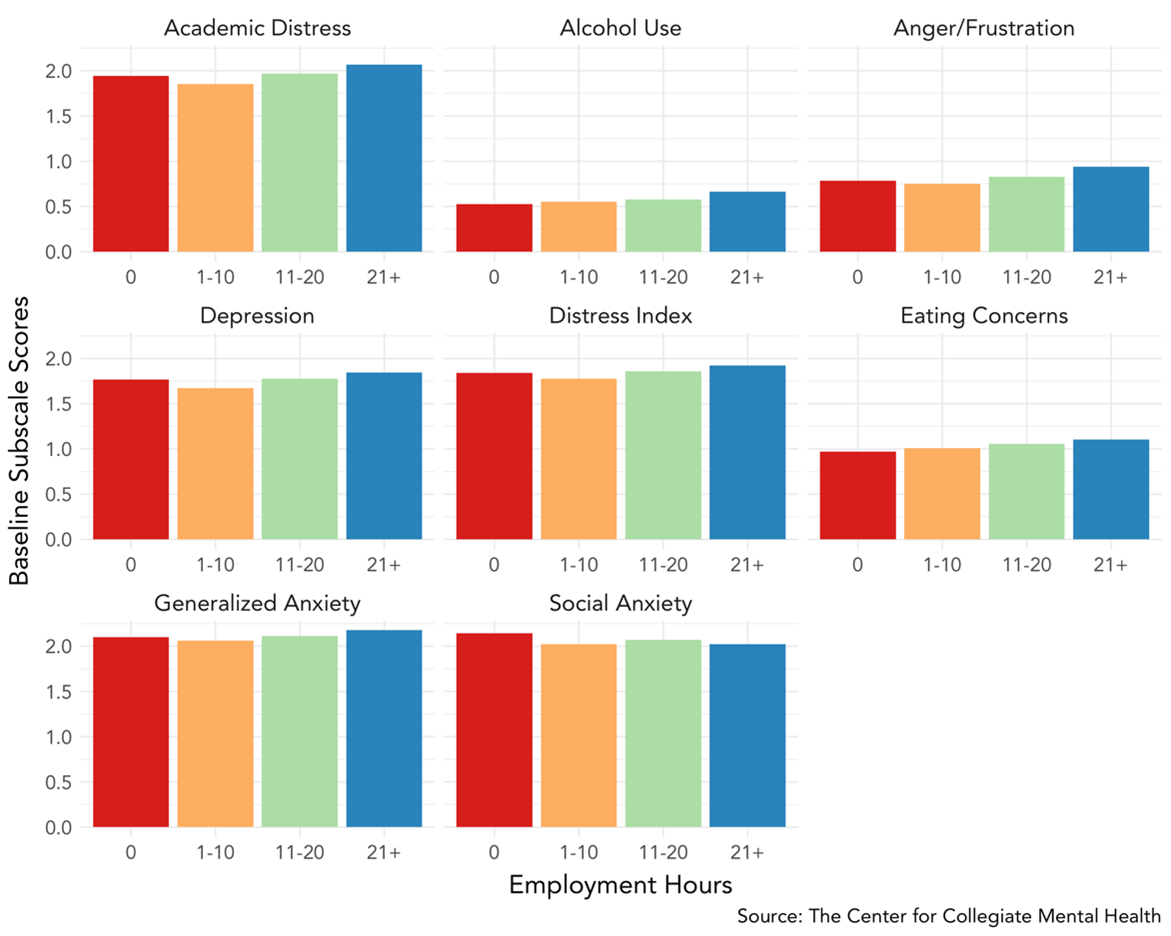
CCAPS-34 Subscales
Students in different employment-hours groups have differences in their CCAPS-34 subscale scores at baseline. When comparing non-working students (0 hours) to students who work at any frequency (1-21+ hours), we found that non-working students had significantly higher baseline scores on Social Anxiety and significantly lower baseline scores on Eating/Body Image, Hostility, and Alcohol Use subscales. Interestingly, when we compared students who work 1-10 hours weekly to students who work 11-21+ hours, we found that these students had lower scores at baseline in every subscale. This trend largely continues when comparing students who work 11-20 hours vs 21+ hours; students working 11-20 hours have lower baseline scores in every subscale except Social Anxiety, where their average scores are higher than students working 21+ hours.
Risk Items
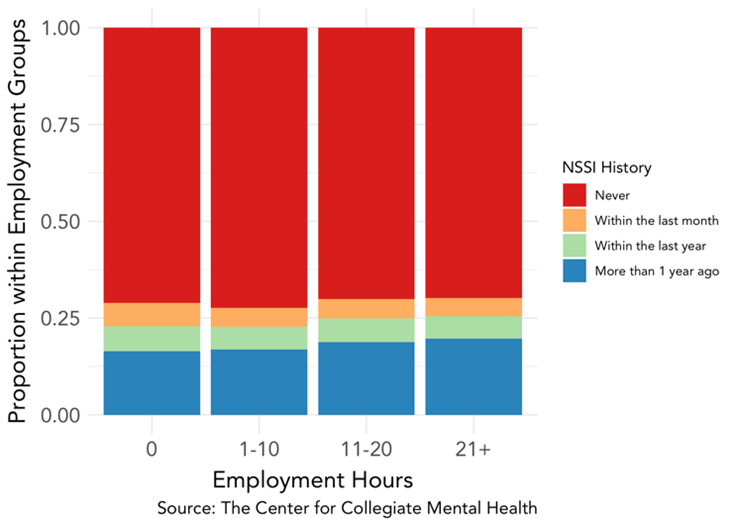
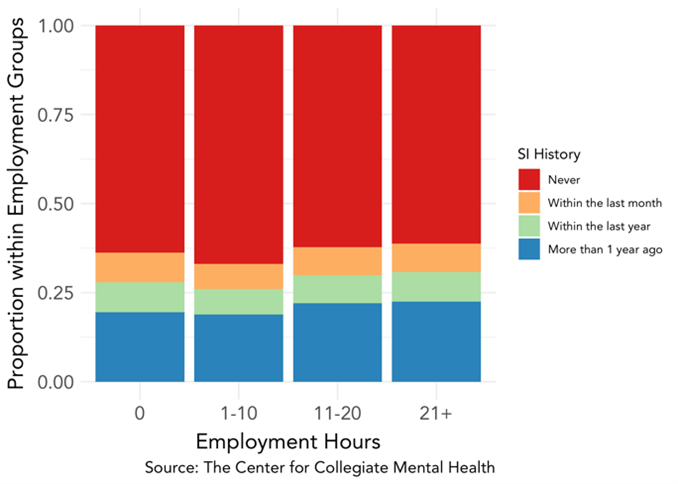
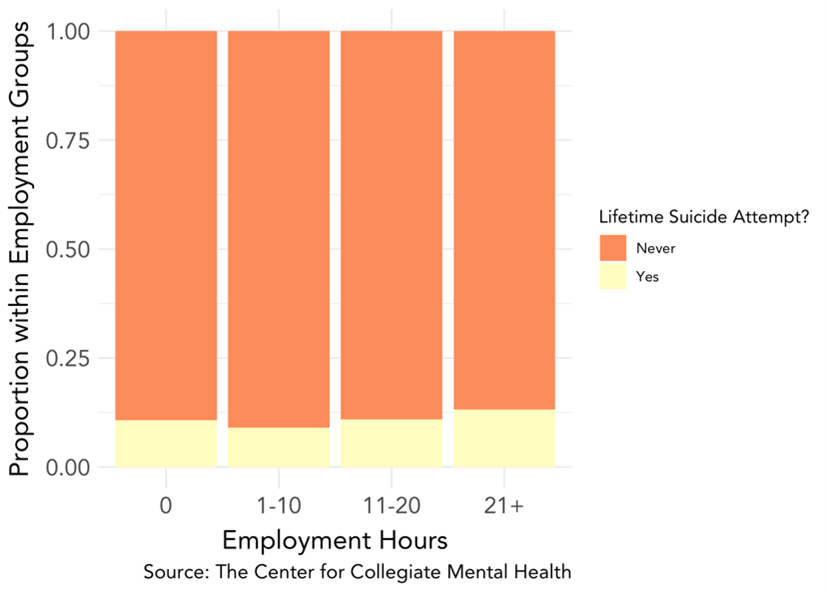
We also examined clients’ baseline responses to items of the SDS that assess history of non-suicidal self-injury (NSSI), history of serious suicidal ideation (SI), and history of suicide attempts. For the first two items, we grouped possible answers into four groups (Never, More than 1 year ago, Within the last year, Within the last month); for the attempts item, answers were grouped into Never and Any.
For the first two risk items (NSSI and SI), we found similar trends. Clients who do not work were slightly more likely to report recent (Within the last month) NSSI (6.0% of nonworking clients relative to the overall 5.4%) and recent (Within the last month) SI (8.3% of nonworking clients relative to the overall 7.9%). In contrast, clients working 1-10 hours were more likely to report Never experiencing both NSSI (72.3 % of 1-10 hours group compared to overall 70.9%) and SI (66.9% of 1-10 hours group compared to overall 63.6%).
Finally, we found that clients working more than 20 hours endorse a higher rate of lifetime suicide attempts (13.2%) compared to the overall percentage (10.8%), while those who work 1-10 hours weekly had a lower endorsement rate (9.0%).
Summary and Implications
Overall, findings indicate that there are differences both in client characteristics and presenting concerns associated with how many hours of weekly paid employment clients have. Employment level (in addition to employment status) should be considered as an important piece of their case conceptualization. While the findings are complex, there are some trends worth highlighting.
Nonworking students (42.5% of our sample) tend to be earlier in their education (first- or second-year undergraduates), are more likely to identify as cisgender men, and are more likely to be Asian American/Asian or White. These students are more likely to describe their financial situations (both growing up and current) as Never stressful or Rarely stressful. Compared to students with any level of paid employment, nonworking students also report baseline lower scores on CCAPS-34 subscales Eating/Body Image Concerns, Hostility, and Alcohol Use, but higher scores on Social Anxiety. Furthermore, nonworking students are more likely to report engaging in non-suicidal self-injury (NSSI) and experiencing suicidal ideation (SI) within the last month when they presented for counseling. They are also more likely to report a registered disability. These findings suggest that students likely have diverse reasons for not having paid employment, potentially including being unaware of employment opportunities as a first- or second-year undergraduate, not needing paid employment to fund their education, and having a physical or psychiatric disability that inhibits their employment opportunities. Additional research is needed to assess the nuance of mixed positive and negative effects of unemployment on college students’ mental health.
On average, students working 1-10 hours per week (18.1% of our sample) presented for counseling with lower distress on all subscales of the CCAPS-34 compared with students who work 11+ hours per week, as well as when compared to nonworking students in many areas (with the exceptions of Alcohol Use and Eating/Body Image Concerns). Students working 1-10 hours were also less likely than students in other employment hour groups to have any lifetime history of non-suicidal self-injury, suicidal thoughts, or suicide attempts. While we’re not able to make any inferences about the direction of this effect, it is interesting to note that these clients are often reporting less distress at intake compared both to clients who aren’t working and those who are working more hours. They were also more likely to report that their financial situations both currently and growing up were rarely stressful. While more research is warranted, we may speculate that perhaps students working limited hours (here, 1-10 weekly) are more likely to have the familial, social, and financial resources available to seek out employment for the sake of the opportunities and advantages found in paid employment experiences as opposed to out of financial necessity (Benner & Curl, 2018).
In comparison, students working over 20 hours per week (16.1% of this sample) report, on average, higher distress than students in any other employment group across most CCAPS-34 subscales, except for Social Anxiety, where the direction is reversed. Students in this employment group are also more likely to report a lifetime history of suicide attempts and to describe their financial situation (both while growing up and current) as Always or Often Stressful. These students are more likely to be first-generation, which is in line with past research indicating that FGS work more hours than their peers, associated with receiving less financial assistance from their parents and having fewer opportunities for insight about college life (Hertel, 2000). Additionally, we found that students working more hours are more likely to identify as Black/African-American or Hispanic/Latinx. Prior research has indicated that students from minoritized racial and ethnic groups are more likely to experience negative consequences associated with student employment, especially when working more hours than their peers (Logan, Hughes, & Logan, 2016; Perna & Odle, 2020). There may also be increased risk of drop-out or switching to part-time student status, which can increase long-term costs of post-secondary education and prolong the time to degree completion.
Put together, the level of clients’ paid employment should be considered an important component of case conceptualization. For some clients, it may be that working a limited number of hours per week has a positive effect on their psychological well-being and ultimate outcomes, and employment in these cases could be seen as a protective factor or something to be encouraged. For other clients (particularly first-generation students, students who identify as Black/African American or Hispanic/Latinx, and/or students who need to work more than 20 hours/week out of financial necessity), employment may be one of many factors contributing to increased stress, burnout, and even increased threat to self. Counselors in these cases may be well-suited to help students determine whether other options are available to them (e.g., financial assistance, employment that would be more in line with their goals to increase future opportunities) and to help students cope with the many competing demands on their time.
This blog post was written by CCMH Business Team member, Natalie Pottschmidt, M.S. Natalie is a Doctoral Student in Clinical Psychology at PSU and a part of the Castonguay Lab.